From a table of measurements — to a research-ready report.
Upload a file — DataStat checks your data quality, runs a complete analysis and hands you a finished report with tables and figures.
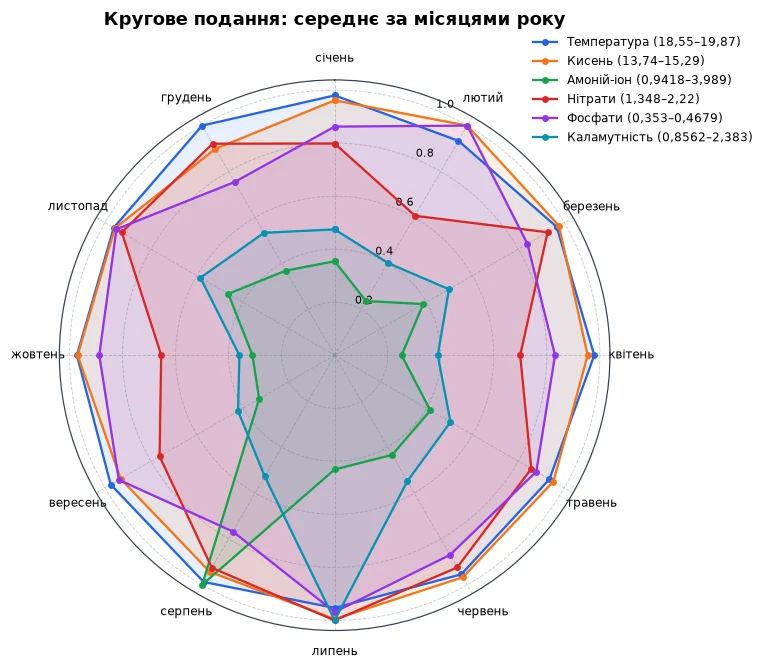
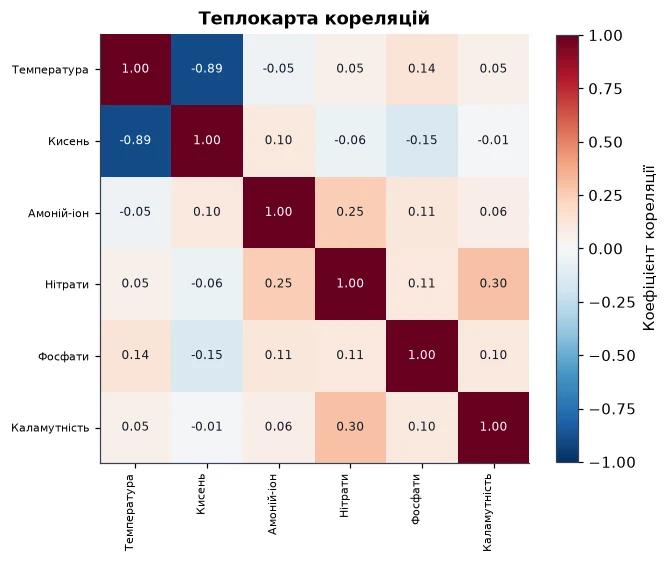
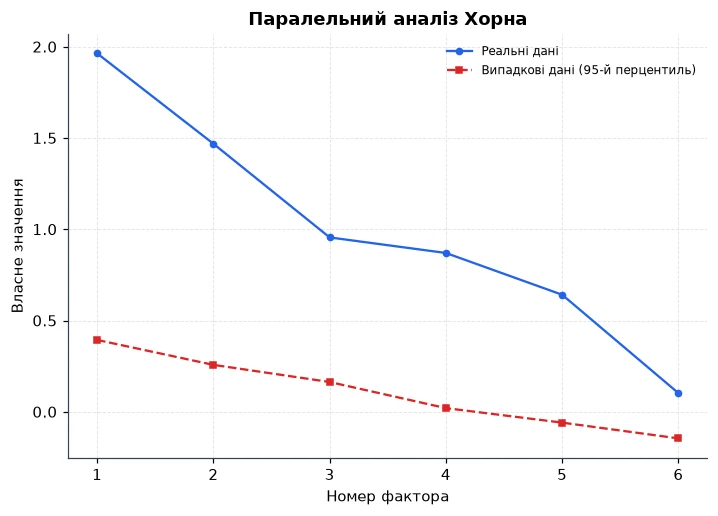
Figures from an actual DataStat report on a demo set of hydrochemical measurements.
How it works
Four steps — from a file to a report.
Upload a table
CSV, TXT or TSV. Encoding and delimiter are detected automatically.
Review the findings
Gaps, duplicates, typos. You approve every correction yourself.
Choose methods
Sensible defaults are preset. Change only what your study needs.
Get the report
Word, Excel and HTML — in Ukrainian or English.
Features
The whole analysis — in one place.
From data quality checks to a factor solution and a report you can drop into a paper.
Exploratory factor analysis
4 extraction methods and 11 rotations, eight criteria for the number of factors, scale reliability and solution stability. Run several methods side by side and compare.
Data quality and cleaning
Gaps, duplicates, decimal commas, marks like “<0.1”. A log of every correction goes into the report.
Descriptives and distributions
Nine normality tests, distribution fitting, Mardia’s multivariate test.
Outlier detection
Several independent methods, from Grubbs to robust Mahalanobis distance. You decide what to do with each outlier.
Correlation and regression
Pearson, Spearman, Kendall with significance tests. Regression with residual and multicollinearity diagnostics.
Cluster analysis
K-means, hierarchical, DBSCAN and Gaussian mixtures. The number of clusters is chosen automatically.
Change over time
If your file has a date column, a dedicated section appears: trend by two methods — least squares and the Mann-Kendall test with Sen’s slope, a seasonal circular view, aggregation by day, week, month and year.
A paper-ready report
You choose the contents: figures only, figures with tables, or everything. Palette, font and figure resolution are yours to pick too.
Accuracy
Numbers you can cite.
A statistical error is invisible — it looks plausible. So every method is verified, never taken on trust.
Checked against benchmarks
The classic Harman (1976) and 2,800-response BFI datasets, plus independent libraries. Loadings are compared with Tucker’s congruence.
Over 400 automated checks
Every night the server recomputes the reference datasets and compares every number with yesterday’s.
No hidden decisions
The software advises but never changes data silently. Every correction, threshold and parameter is recorded in the report.
Who it’s for
For people who need results, not a statistics package.
Researchers and graduate students
- Ecology, hydrochemistry, atmospheric chemistry — built together with a researcher from this field.
- Psychology and sociology — factor analysis of questionnaires and scale reliability.
- Any table of measurements where you need to find relationships and structure.
Your data stays yours
- Only you can see your files and reports, from your own account.
- The server is located in Finland, in the European Union.
- Nothing is deleted automatically: research data never disappears on its own.
FAQ
Frequently asked questions.
What file can I upload?
A CSV, TXT or TSV table up to 40 MB: up to 8,000 rows and up to 60 numeric variables. Encoding and delimiter are detected automatically.
How long does a run take?
About ten seconds for a full report on a 200-row file. Large files with thousands of rows take a minute or two.
What counts as one analysis?
One uploaded file. Re-running the same file with different settings uses no extra analyses and is unlimited: what counts is the dataset, not the tuning.
What language is the report in?
Ukrainian or English — you choose before the run. The service interface is currently in Ukrainian.
Do I need to know statistics?
A basic understanding helps, but the software guides you at every step: which method suits your data and why. Advice explains — it never decides for you.
Your data is ready to tell you more.
Upload your first table and get a report in minutes.
Try DataStat